AUSTIN, Texas — The U.S. Census Bureau released new data Thursday about the country's population and demographics.
Like the rest of the world's population, Americans are growing older.
"This aging is driven in large part by Baby Boomers crossing over the 65-year-old mark. Now half of the U.S. population is over the age of 38.2,” said Luke Rogers, the Chief of the Population Estimates Branch at the Census Bureau.
While Texans are also getting older, the Lone Star State's population is younger than the rest of the country's. The median age in Texas is 34.
RELATED:
Lila Valencia, Ph.D., Senior Demographer for the Texas Demographic Center, said that's largely due to migration. Dr. Valencia said people come to Texas from other states and countries when they're younger and then start families in Texas.
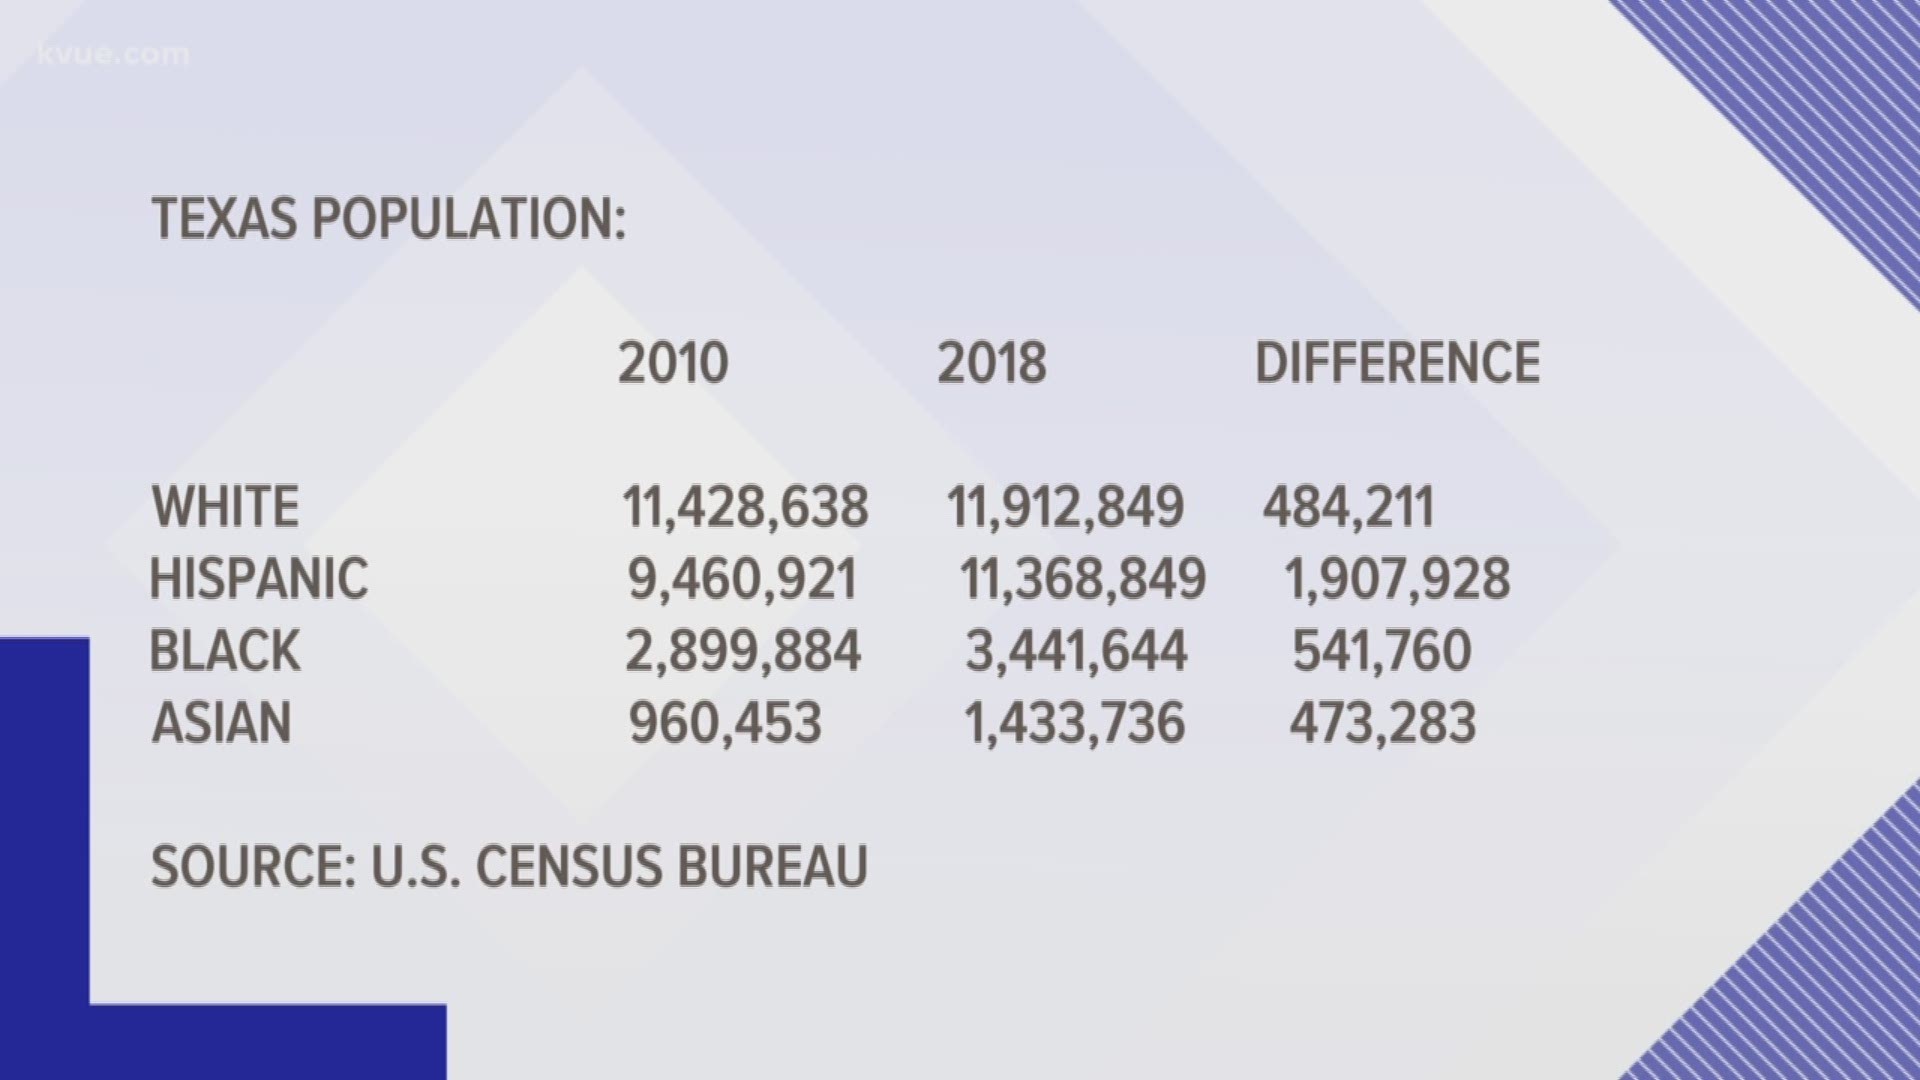
When comparing data from the April 2010 census to the July 1, 2018 data that was just released, Texas saw an overall population increase of about 3.5 million people.
Breaking that growth down by race reveals for every white resident added to the Texas population, the state also gained about nine Hispanic residents.
While the Hispanic population is growing, it isn't the fastest growing population in the state.
"The Asian population, even though it's a much smaller population, is the fastest growing population in Texas, as well as in Travis County. In Travis County, they grew at about 50%," Dr. Valencia said.
She added the Asian population doubled in Williamson County between 2010 and 2019 and nearly doubled in Hays County.
As for the future of Texas, the Texas Demographic Center estimates Hispanic residents will be the majority by 2022, noting the median age of Hispanics in Texas is 28 years old, compared to the median age of whites, which is 42 years old.
Texas Population Growth by Race/Ethnicity (SOURCE: U.S. Census Bureau)
WHITE
In 2010: 11,428,638
In 2018: 11,912,849
Difference: 484,211
HISPANIC
In 2010: 9,460,921
In 2018: 11,368,849
Difference: 1,907,928
BLACK
In 2010: 2,899,884
In 2018: 3,441,644
Difference: 541,760
ASIAN
In 2010: 960,453
In 2018: 1,433,736
Difference: 473,283
OTHER
In 2010: 395,575
In 2018: 544,767
Difference: 149,192
PEOPLE ARE ALSO READING:

