
HOUSTON — Houston summers are notoriously hot but they can be even more painful depending on where exactly you are.
“Where you are in Houston, you can be experiencing heat really differently,” Dr. Stephanie Piper, Houston Advanced Research Center, said.
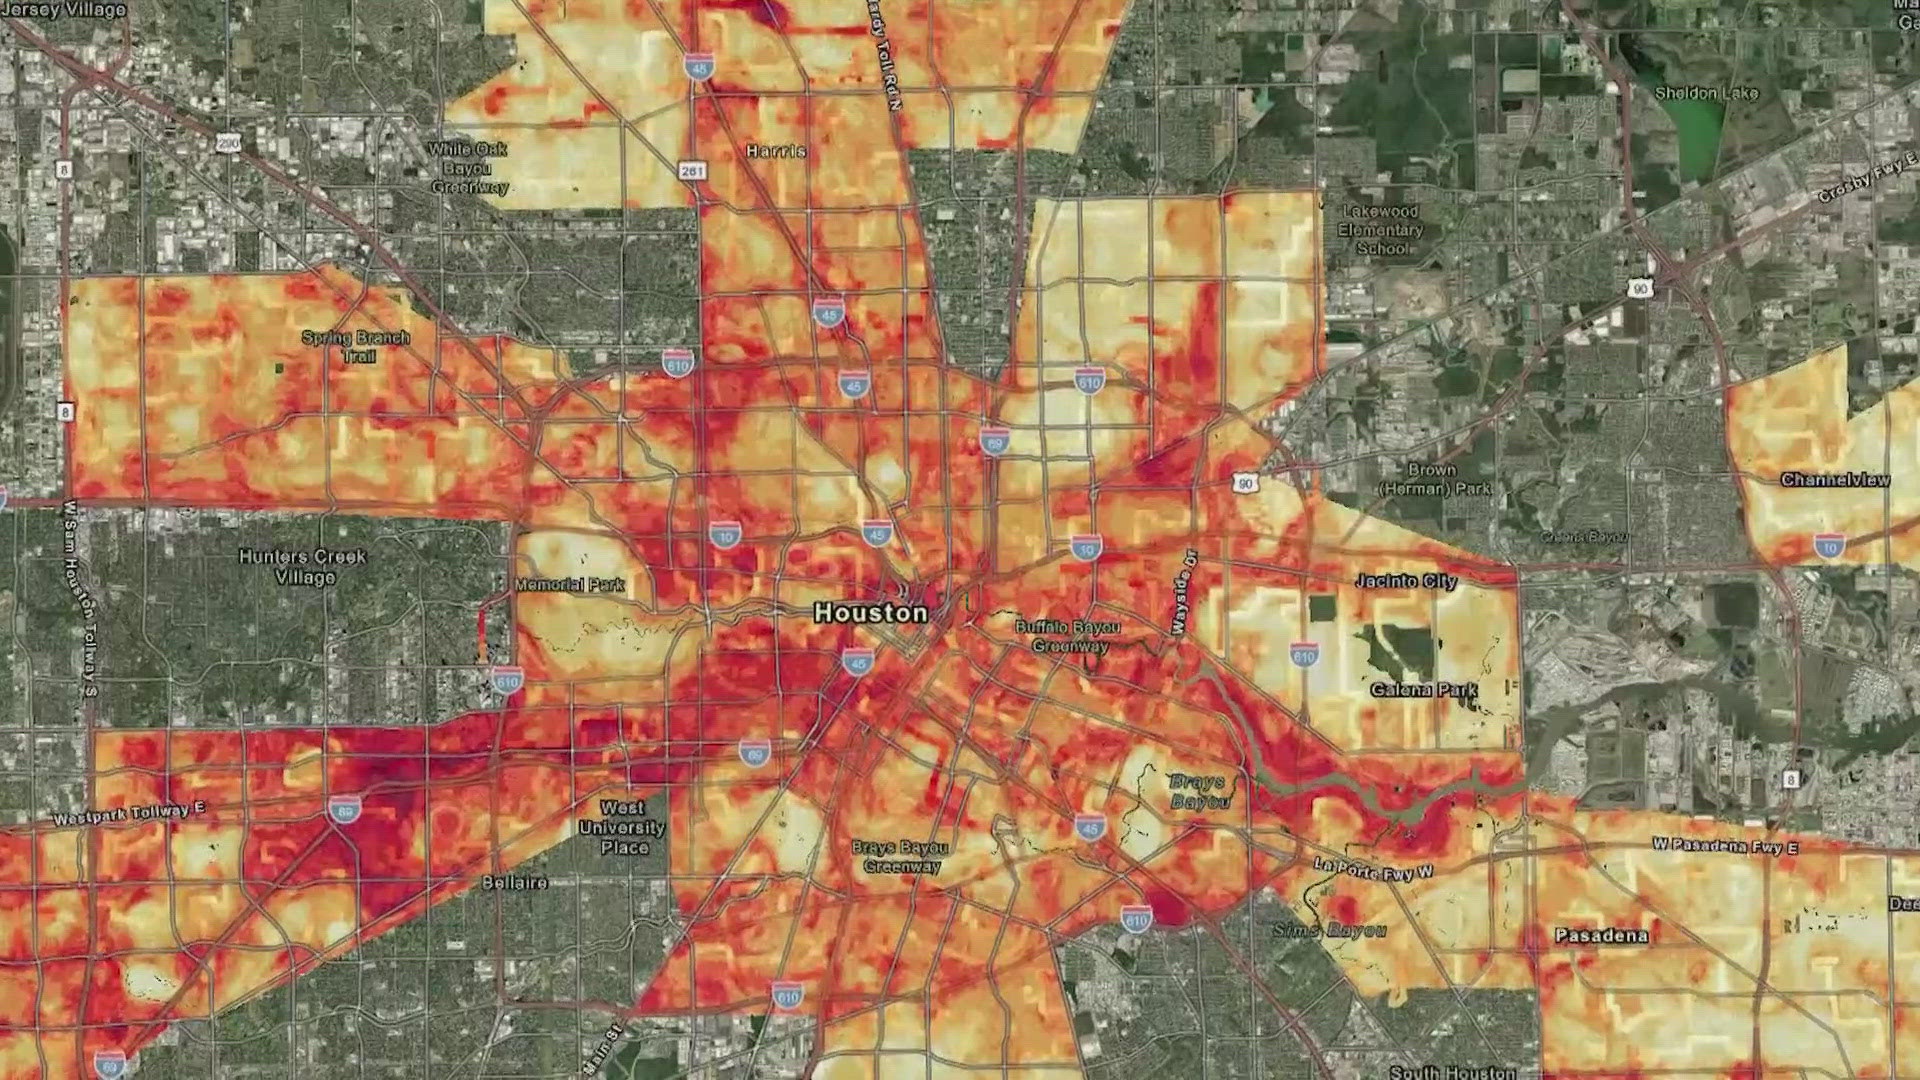
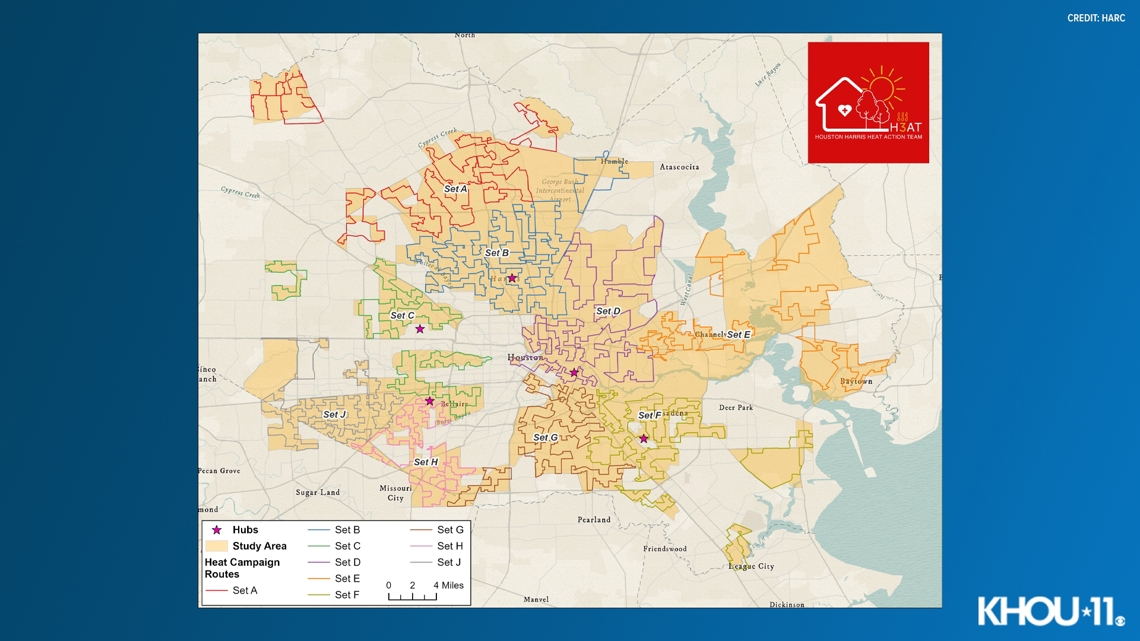
Piper studies the heat’s impact, and earlier this month, she said her organization held the largest single-day heat mapping campaign in the U.S.
“The goal of that is to get a really good picture of across the entire city of Houston, as well as Harris County as a whole, what the heat looks like, where there are hot spots, where we can really highlight the need for heat mitigation,” she said.
More than 80 scientists and 150 volunteers measured the heat over the course of a day using a specific tool.
“You just kind of hook it onto a car window to this little, you know, cavity here. And it sticks in your car window. You drive up to 35 miles an hour, and it collects data every second,” she said.
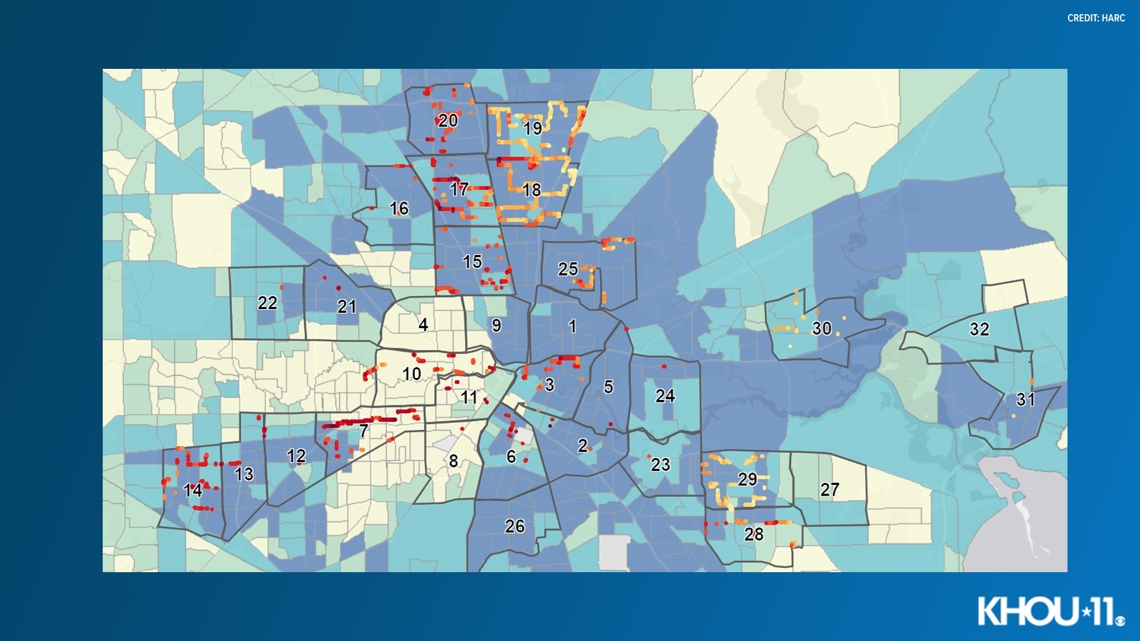
Piper and her team are still analyzing that data and plan to make this new round of data available to the public by early next year. However, she said a previous study in 2020 revealed a potentially troubling pattern.

“Income is definitely a major, you know, variable that we're looking at,” she said. “And we do see higher heat in lower-income areas.”
There is this phenomenon in urban ecology called the luxury effect, where higher-income neighborhoods have higher tree cover.
Tree cover acts as a natural protection from the sun, not only providing shade but actually cooling the air around them.
Piper said lower-income neighborhoods often have fewer trees and far more concrete surfaces.
“The concrete is just going to suck up all that heat and hold that heat. Even as you know, the sun goes down, you still get heat that's held in the concrete,” she said.
The 2020 study showed a 17-degree temperature swing between the hottest and coolest neighborhoods in Houston.

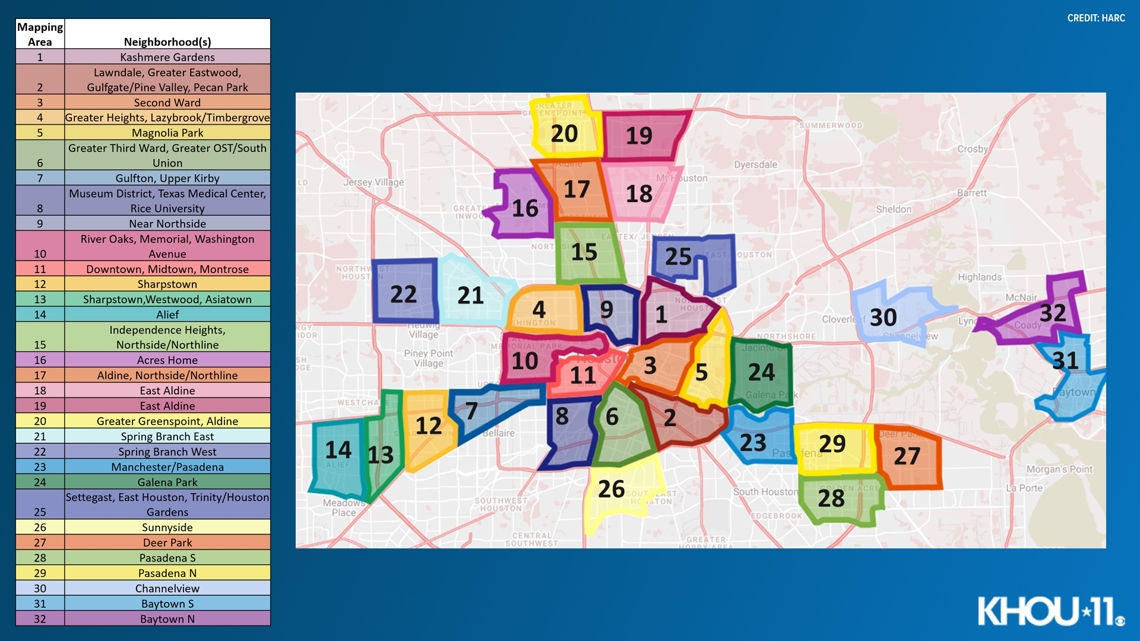
Gulfton, where we met Dr. Piper, was one of the hottest zones in the city.
So what does all this really mean on a day when feels-like temperatures are expected to be over 100? We used a heat gun to help us learn exactly what the temperature is like here on this pavement.
The heat gun registered a temp at about 144. How different is that from where the shade and canopy is? The temp there registered at 110.
“One park in a three-square mile radius that is like that is unacceptable,” Sandra Rodriguez, president of the Gulfton Super Neighborhood Council, said.
Rodriguez said she has spent nearly her entire life in Gulfton.
“I've talked to residents where they're standing at the bus stop, and they're so hot that they feel like fainting as they get to and from work,” she said.

It’s why Rodriguez and the Gulfton Super Neighborhood Council are pushing to plant more trees.
We stopped at Burnett Baylin Park which is not far from where we used the heat gun to check the temperature. We wanted to see how much of a difference the green space makes.
The temperature was about 10 to 15 degrees hotter in the heat where we were before and all that concrete.
What about in the shade? The temperature was another 10 to 12 degrees cooler at the park surrounded by greenery.
Dr. Piper and her organization will be increasing that greenery using their 2020 research and the data from this month’s heat mapping to guide them as they plant 50,000 trees in the Houston neighborhoods that need them most.